Image Plot of Bootstrap Uncertainty for Cumulative Incidence Functions
Source:R/plot_boot_cuminc2ts.R
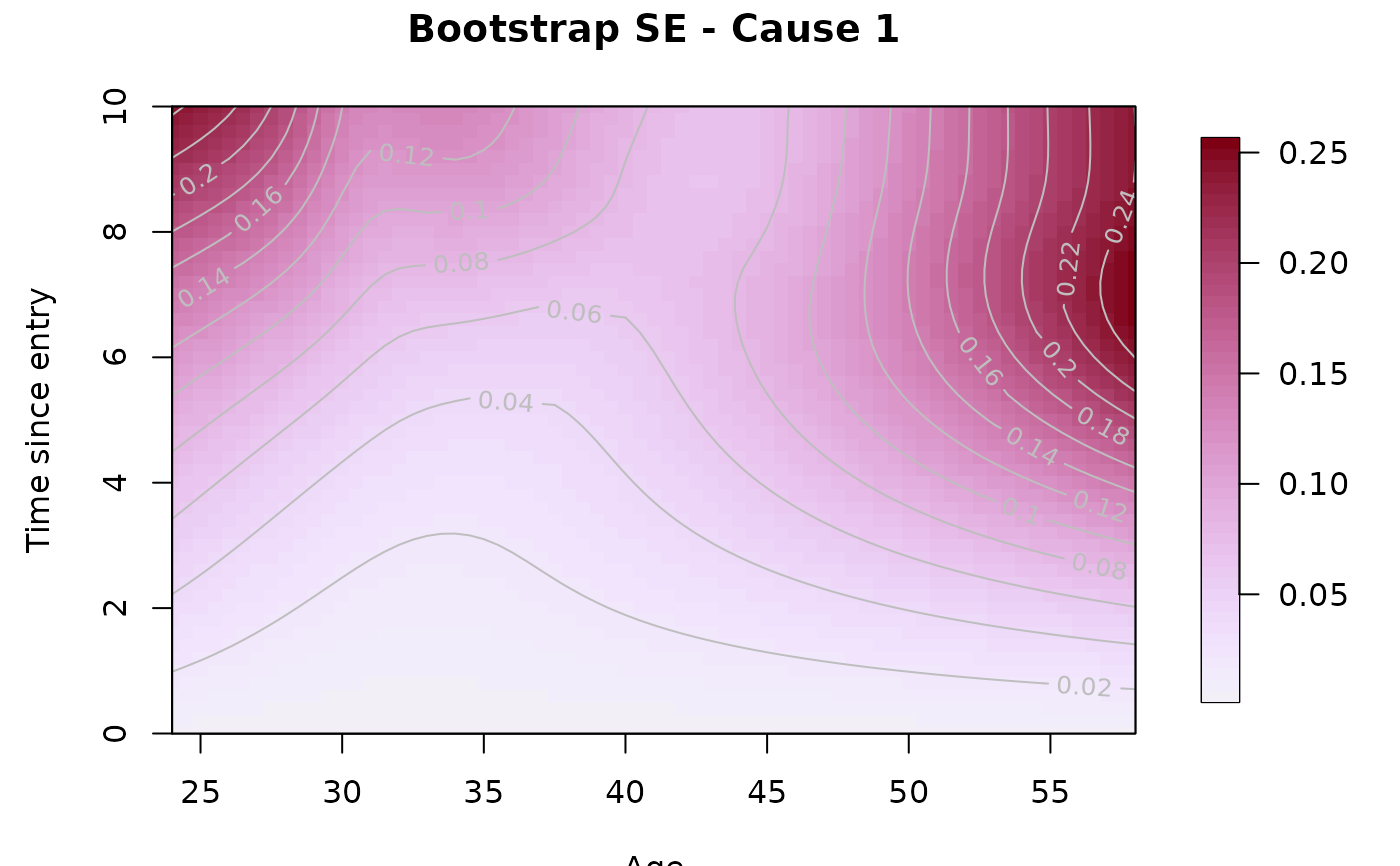
plot_boot_cuminc2ts.Rdplot_boot_cuminc2ts() plots an image of the pointwise bootstrap
uncertainty measures (lower bound, upper bound, or standard errors)
for the cumulative incidence function of a single cause, over two
time scales.
Arguments
- boot_object
The object returned by
boot_cuminc2ts(), a list with elementsresults(one per cause) andgrid.- which_cause
A character string or integer indicating which cause to plot. If a character string, it must match one of the names in
boot_object$results. If an integer, it is used as an index.- which_quantity
A character string specifying which uncertainty measure to plot. One of
"lower","upper", or"se". Default is"se".- plot_options
A list of options passed to
imageplot_SE(). Seeimageplot_SEfor the full list of options.- ...
Further arguments passed to
imageplot_SE().
Value
An image plot of the selected bootstrap uncertainty measure for the cumulative incidence function of the selected cause.
Examples
# --- Fake data -----------------------------------------------------------
set.seed(1234)
n <- 30
fakedata <- data.frame(
  id     = 1:n,
  u      = round(runif(n, min = 24, max = 58), 2),
  s_out  = round(runif(n, min = 0.5, max = 10), 2),
  cause1 = c(rep(1, 8), rep(0, 22)),
  cause2 = c(rep(0, 8), rep(1, 7), rep(0, 15))
)

# --- Bootstrap -----------------------------------------------------------
boot_cif <- boot_cuminc2ts(
  data     = fakedata,
  causes   = c("cause1", "cause2"),
  cause_names = c("cause1", "cause2"),
  prepare_data_args = list(
    u      = "u",
    s_out  = "s_out",
    min_u  = 24, max_u = 58,
    min_s  = 0,  max_s = 10,
    du     = 1,  ds    = .5
  ),
  fit2ts_args = list(
    Bbases_spec = list(
      bdeg   = 3,
      nseg_u = 7, min_u = 24, max_u = 58,
      nseg_s = 3, min_s = 0, max_s = 10
    ),
    optim_criterion = "bic"
  ),
  cumhaz2ts_args = list(
    plot_grid = list(
      c(umin = 24, umax = 58, du = .5),
      c(smin = 0,  smax = 10, ds = .2)
    )
  ),
  ds         = .2,
  nboot          = 10,
  seed       = 1234,
  conf_level = 0.95,
  parallel   = FALSE
)
#>
  |
  |                                                                      |   0%
#> `s_in = NULL`. I will use `s_in = 0` for all observations.
#> `s_in = NULL`. I will use `s_in = 0` for all observations.
#> `s_in = NULL`. I will use `s_in = 0` for all observations.
#> `s_in = NULL`. I will use `s_in = 0` for all observations.
#>
  |
  |=======                                                               |  10%
#> `s_in = NULL`. I will use `s_in = 0` for all observations.
#> `s_in = NULL`. I will use `s_in = 0` for all observations.
#> `s_in = NULL`. I will use `s_in = 0` for all observations.
#> `s_in = NULL`. I will use `s_in = 0` for all observations.
#>
  |
  |==============                                                        |  20%
#> `s_in = NULL`. I will use `s_in = 0` for all observations.
#> `s_in = NULL`. I will use `s_in = 0` for all observations.
#> Warning: Max number of iterations 20 reached but the algorithm did not converge.
#> Warning: Max number of iterations 20 reached but the algorithm did not converge.
#> Warning: Max number of iterations 20 reached but the algorithm did not converge.
#> `s_in = NULL`. I will use `s_in = 0` for all observations.
#> `s_in = NULL`. I will use `s_in = 0` for all observations.
#>
  |
  |=====================                                                 |  30%
#> `s_in = NULL`. I will use `s_in = 0` for all observations.
#> `s_in = NULL`. I will use `s_in = 0` for all observations.
#> `s_in = NULL`. I will use `s_in = 0` for all observations.
#> `s_in = NULL`. I will use `s_in = 0` for all observations.
#>
  |
  |============================                                          |  40%
#> `s_in = NULL`. I will use `s_in = 0` for all observations.
#> `s_in = NULL`. I will use `s_in = 0` for all observations.
#> `s_in = NULL`. I will use `s_in = 0` for all observations.
#> `s_in = NULL`. I will use `s_in = 0` for all observations.
#>
  |
  |===================================                                   |  50%
#> `s_in = NULL`. I will use `s_in = 0` for all observations.
#> `s_in = NULL`. I will use `s_in = 0` for all observations.
#> `s_in = NULL`. I will use `s_in = 0` for all observations.
#> `s_in = NULL`. I will use `s_in = 0` for all observations.
#>
  |
  |==========================================                            |  60%
#> `s_in = NULL`. I will use `s_in = 0` for all observations.
#> `s_in = NULL`. I will use `s_in = 0` for all observations.
#> `s_in = NULL`. I will use `s_in = 0` for all observations.
#> `s_in = NULL`. I will use `s_in = 0` for all observations.
#>
  |
  |=================================================                     |  70%
#> `s_in = NULL`. I will use `s_in = 0` for all observations.
#> `s_in = NULL`. I will use `s_in = 0` for all observations.
#> `s_in = NULL`. I will use `s_in = 0` for all observations.
#> `s_in = NULL`. I will use `s_in = 0` for all observations.
#>
  |
  |========================================================              |  80%
#> `s_in = NULL`. I will use `s_in = 0` for all observations.
#> `s_in = NULL`. I will use `s_in = 0` for all observations.
#> `s_in = NULL`. I will use `s_in = 0` for all observations.
#> `s_in = NULL`. I will use `s_in = 0` for all observations.
#>
  |
  |===============================================================       |  90%
#> `s_in = NULL`. I will use `s_in = 0` for all observations.
#> `s_in = NULL`. I will use `s_in = 0` for all observations.
#> `s_in = NULL`. I will use `s_in = 0` for all observations.
#> `s_in = NULL`. I will use `s_in = 0` for all observations.
#>
  |
  |======================================================================| 100%
#> Warning: 2 out of 10 bootstrap replicates failed and were discarded.
#> `s_in = NULL`. I will use `s_in = 0` for all observations.
#> `s_in = NULL`. I will use `s_in = 0` for all observations.
#> Done. 8 successful replicates out of 10 attempted.

# --- Plot standard errors for cause 1 ------------------------------------
plot_boot_cuminc2ts(
  boot_object   = boot_cif,
  which_cause   = "cause1",
  which_quantity = "se",
  plot_options  = list(
    main = "Bootstrap SE - Cause 1",
    xlab = "Age",
    ylab = "Time since entry"
  )
)

#> NULL